Track Your Solar Performance Easily: Step-by-Step Guide to Using Sole Smart
Trying to monitor your solar panel’s performance? Stop the hassle! With the Sole Smart app, you get real-time tracking, efficiency insights, and complete control over your solar energy all in one place!
No more guessing how much energy you’re producing or worrying about system performance. Just download the Sole Smart app, log in, and take charge of your solar investment effortlessly!
Step 1: Get the Sole Smart App & Take Control of Your Solar Energy!
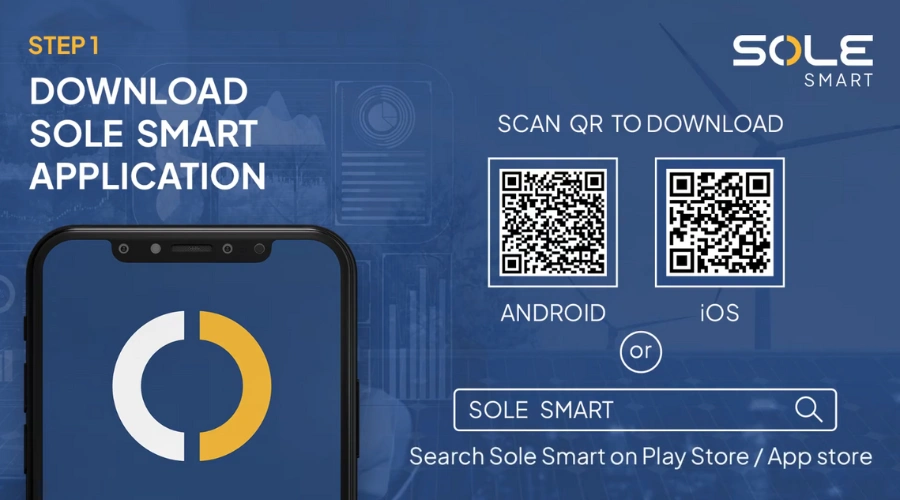
Before you can start tracking your solar panel’s performance, you need the Sole Smart app on your smartphone. It’s quick and easy!
Scan & Download – Simply scan the QR code from the image above based on your device (Android / iOS) and install the app instantly.
(OR)
Search & Install – Open your Google Play Store (Android) or App Store (iOS) and search for “Sole Smart”. Click Download & Install to get started.
Step 2: Open Sole Smart App & Register
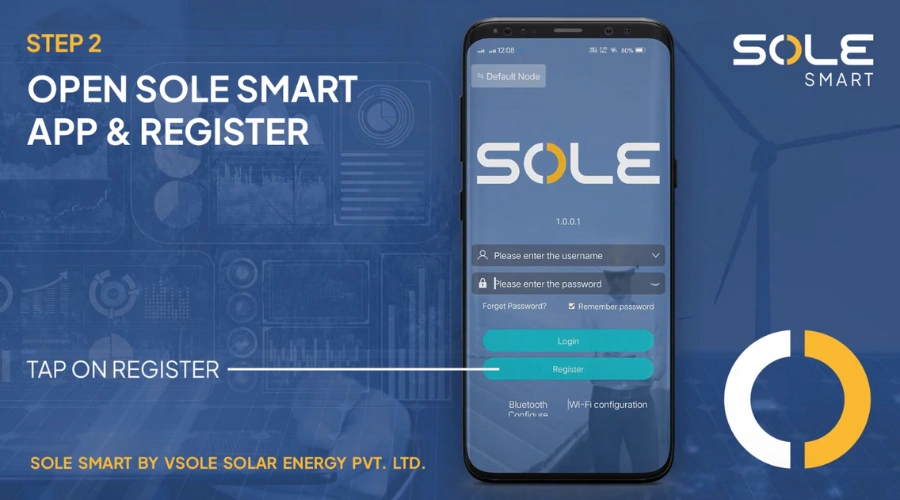
- Open the Sole Smart app on your mobile device.
- Tap on “Register” to create a new account.
Step 3: Fill Required Details
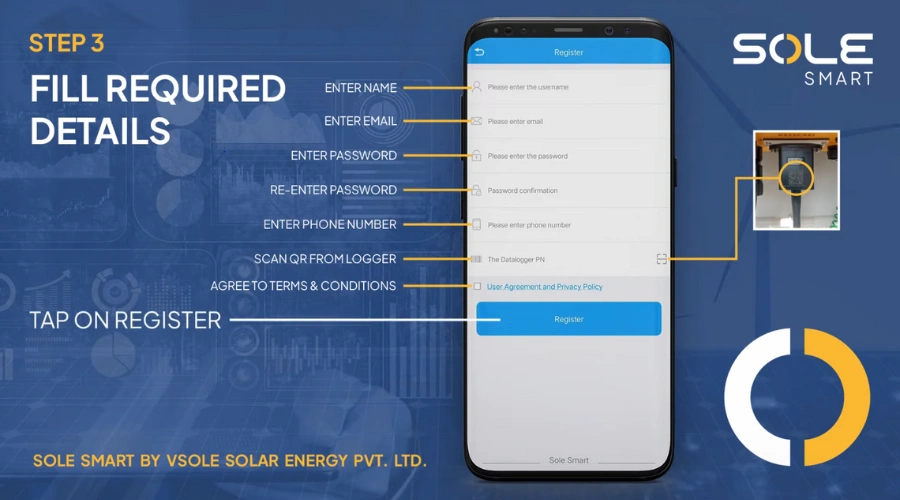
- Enter your Name, Email, and Phone Number.
- Create a strong password and confirm it.
- Scan the QR code from the logger to get Data logger PIN
- Agree to the Terms & Conditions.
- Tap on Register to complete the signup process.
Step 4: Connecting to Dongle
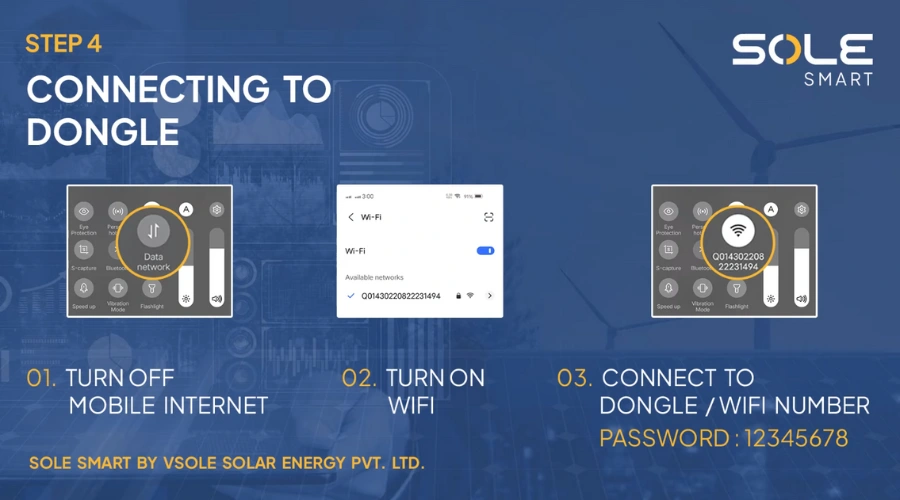
- Turn off mobile internet
- Turn on WiFi on your phone.
- Connect to the dongle’s WiFi using the provided network name and password.
Step 4.2: Connecting to Dongle (Continued)
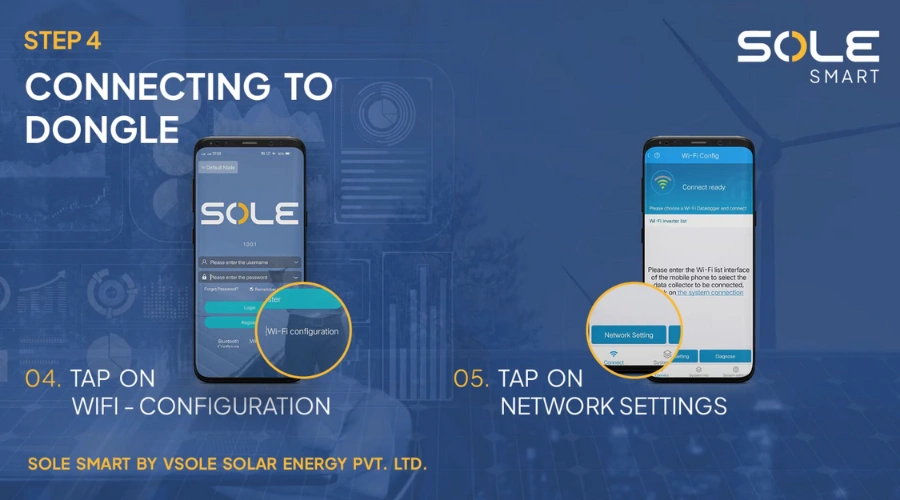
- Tap on WiFi Configuration in the Sole Smart app.
- Tap on Network Settings to select and configure the dongle’s network.
This ensures a stable connection between the app and the dongle for real-time data access.
Step 4.3: Connecting to Dongle (Final Step)
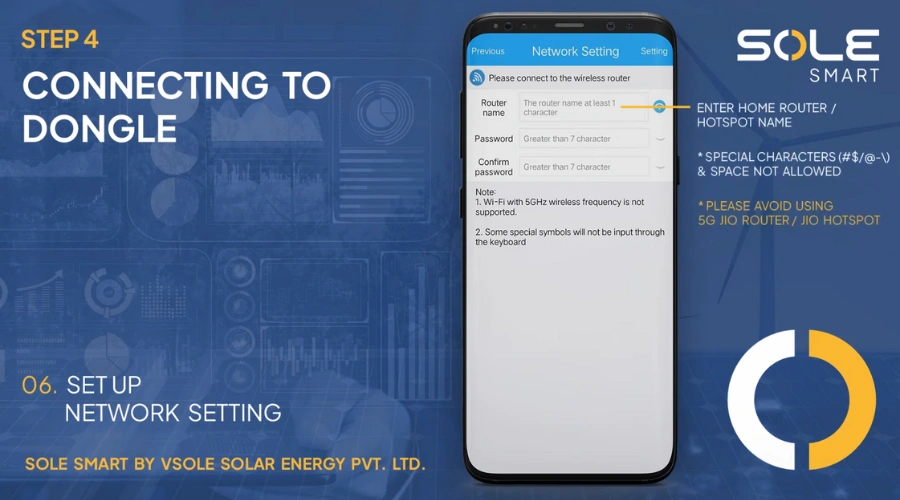
Set Up Network Settings
- Enter your home router or hotspot name.
- Create a password (must be more than 7 characters).
- Confirm the password.
Important Notes:
- Special characters like #$/@-\ and spaces are not allowed in the router name.
- 5GHz Wi-Fi is not supported (use 2.4GHz Wi-Fi).
- Avoid using 5G Jio routers or Jio hotspots as they may not be compatible.
Step 4.4: Completing the Connection to the Dongle
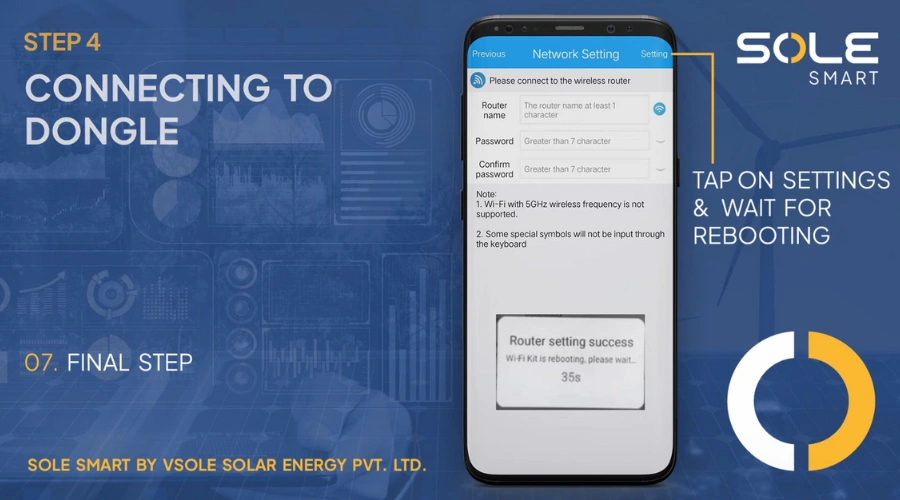
- Tap on “Settings” to confirm your network setup.
- Wait for the rebooting process to complete. This will take about 35 seconds.
- Once done, your Wi-Fi Kit will be successfully connected to the network.
You have now completed the setup process! Your Sole Smart system is ready to use.
Step 5: Connecting to the Mobile Network
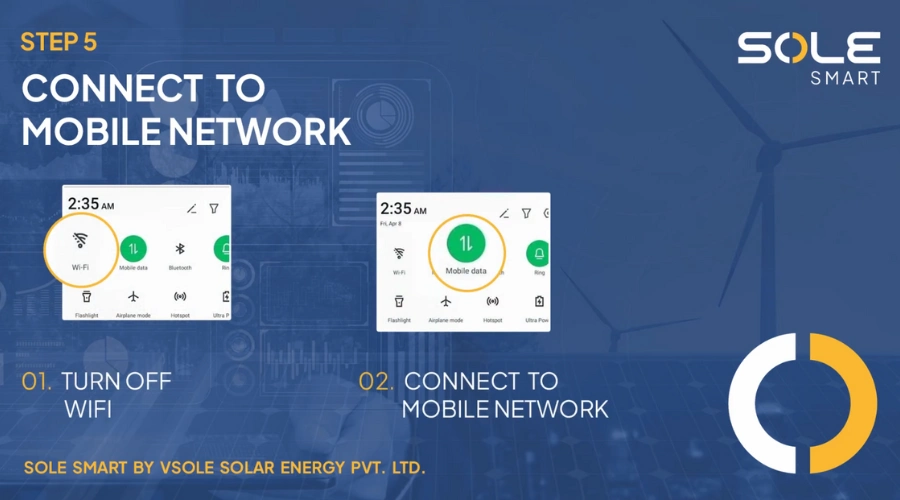
- Turn off Wi-Fi to ensure a direct mobile network connection.
- Enable Mobile Data to connect to your network provider.
Step 6: Login & Monitor
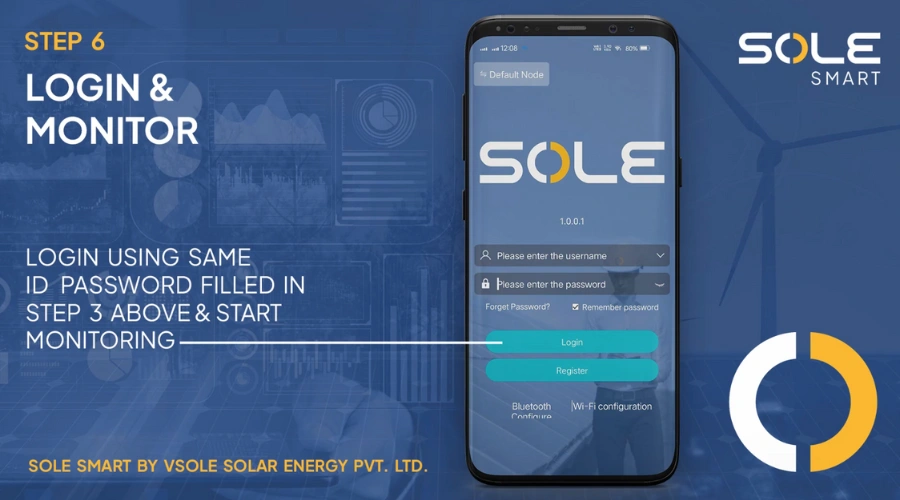
- Open the SOLE SMART
- Enter the username and password you set in next
- Tap Login to access the system.
Start monitoring your solar system's performance in real time.
This is your Plant List Dashboard – your starting point after logging into the Sole Smart app.
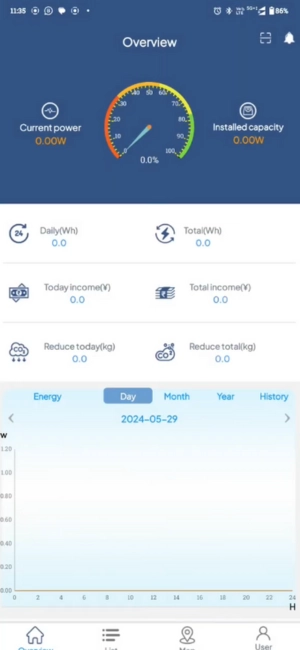
1. Current Power (Top Left)
What it means: Shows real-time energy your system is generating.
Example: If it’s showing
0.00W, your panels are not currently generating power (possibly due to no sunlight or a connection issue).
2. Installed Capacity (Top Right)
What it means: Displays the total power capacity your solar panels are rated for.
Example: If your system is 3kW, it will show
3000Wwhen connected properly.
3. Gauge Meter (Center)
What it means: Visual representation of your solar system’s efficiency in percentage.
Pro Tip: A moving needle means your system is actively producing energy!
4. Daily & Total Energy (Middle Row)
Daily (Wh) – Energy generated today.
Total (Wh) – Total lifetime energy your system has produced.
5. Income Insights (Middle Row)
Today Income (¥) – Your earnings or savings for the current day.
Total Income (¥) – Cumulative value of all energy produced.
6. Environmental Impact (Bottom Row)
Reduce Today (kg) – Estimated carbon emissions avoided today.
Reduce Total (kg) – Total carbon reduction over time.
7. Energy Graph (Bottom Section)
Day/Month/Year/History Tabs – Toggle between different time ranges.
Blue Graph – Displays energy generated per hour throughout the selected date.
Note: If all values are 0, check:
If it’s nighttime or cloudy.
If your system or dongle is properly connected.
If the setup was recently completed (data may take time to reflect).
Your main control room to monitor live data and stats. View All Your Solar Installations in One Place
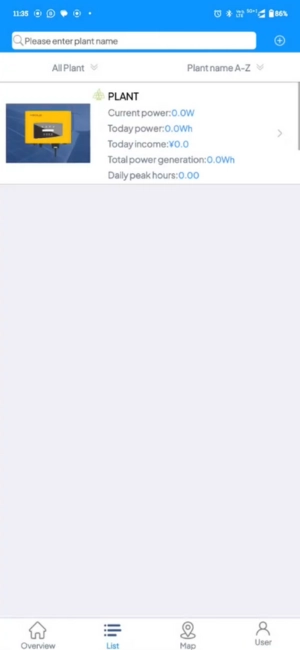
1. Plant Name Section
This section shows each solar installation (referred to as a “Plant”).
Each plant has a name, thumbnail image, and basic performance data.
Tip: If you manage multiple locations, you can quickly switch and monitor each one from here.
2. Search & Filter Bar (Top)
Search: Enter your plant’s name to find it quickly.
Filter Options:
All Plant – View all registered plants.
Plant name A-Z – Sort plants alphabetically.
3. Key Metrics Displayed per Plant
Each plant shows the following data in real-time:
Current Power (W): How much power is being generated now.
Today Power (Wh): Total power generated today.
Today Income (¥): Money saved or earned today.
Total Power Generation (Wh): Total lifetime energy generated.
Daily Peak Hours: Hours when the system was most efficient during the day.
4. Quick Navigation Panel (Bottom Menu)
Overview: Go back to the main dashboard.
List: You are here – manage and view plants.
Map: View plant locations on the map.
User: Manage your profile and settings.
Useful Tip:
If you’re seeing all zeros:
Check your solar system’s connection status.
Make sure it’s daytime and your panels are exposed to sunlight.
Ensure proper Wi-Fi dongle connection and app setup.
